As the gold rally gained momentum in H2 2024, we launched a series of structured products linked to gold in response to a noticeable uptick in client demand (Product Highlight Below).
Market Commentary and why we made the product
Here’s a summary of the key drivers behind the gold rally over the past year (May 2024–May 2025):
- Central Bank Demand: Persistent and aggressive gold buying by central banks of emerging market, led by China, Turkey, and India. This likely reflects a desire to diversify away from USD reserves, which became especially acute following the Russia-Ukraine war. According to the World Gold Council, central banks globally have been net buyers of gold for 15 consecutive years, with annual purchases exceeding 1,000 tonnes from 2022 through 2024.
Official gold reserves rose by a further 53T
(From September 2024 to November 2024)

Source: IMF IFS, respective central banks, World Gold Council
- Geopolitical Risk & Safe-Haven Demand: Rising global tensions have sustained demand for gold as a hedge. During the Gulf War in 1990, gold rallied over 10% in the weeks following Iraq’s invasion of Kuwait1. In the 2008 financial crisis, gold embarked on a multi-year bull run, topping $1,900/oz by 2011 amid fears of negative impact from quantitative easing policies2. The 2014 Crimea annexation and U.S.-China trade war episodes saw renewed safe-haven flows into gold. Today, the ongoing Russia-Ukraine war, escalating tensions in the Middle East, and the resurgence of trade protectionism have a similar effect.
- U.S. Real Yields and Fed Policy Pivot Expectations: Despite high nominal yields, real rates began to moderate in late 2024 as inflation proved sticky and growth indicators softened. While the 10-year Treasury is near 4.5%, real yields (adjusted for inflation) are more important to understanding the attractiveness of gold. If inflation is running at, say, 3%, the real yield is around 1.5%, which would still be relatively low.
- USD Weakness: A weaker dollar makes gold cheaper for foreign buyers, boosting overall demand.
- Retail and Institutional Flows: A surge in ETF inflows and a renewed push into gold by macro hedge funds. After declining for years, ETF holdings in the U.S. bottomed in mid-2024 and steadied and increased over the last few quarters.
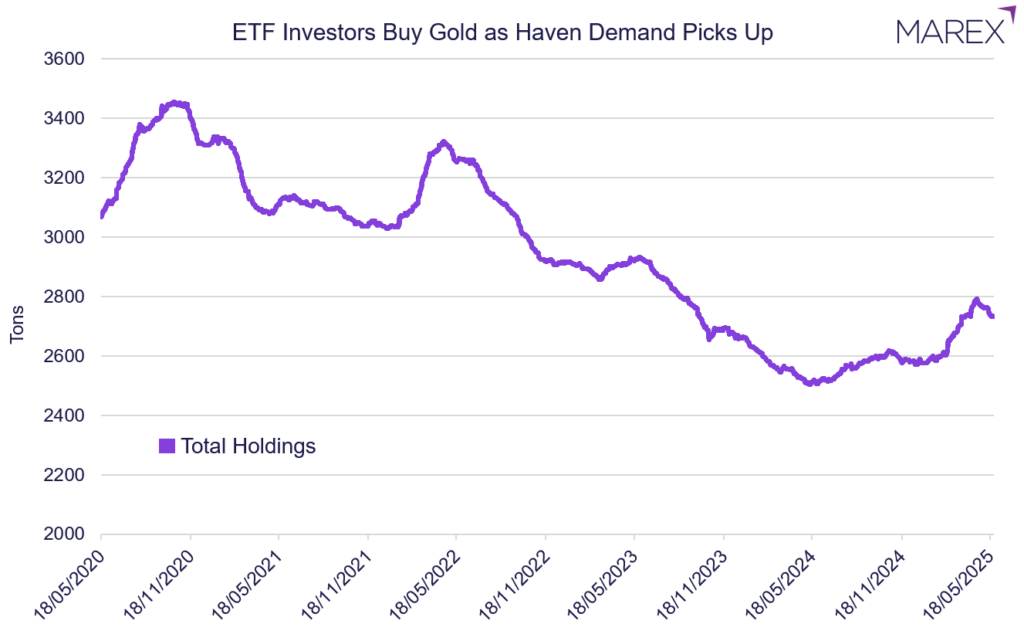 Source: Marex, Bloomberg
Product highlight:
One creative way to gain exposure to gold is to link it with the price of silver, given the typical historical correlation between the two. In our year-ahead Investment Opportunities publication, we presented one popular version of this idea: A 2-year fully capital-protected note on an equally weighted basket of gold and silver.
Interested in Gold Exposure?
*All requests will be reviewed internally before granting access to the 2025 Investment Opportunities e-booklet. Please note, this is for professional/institutional investors only and may not be shared.
Footnotes
- Gold prices rallied more than $40 in the two months leading up to the start of the Persian Gulf war, going from an average trading price of $352.33 in June 1990 to an average of $394.73 in August 1990 amid the Iraqi invasion of Kuwait and the start of the war. Source: CNN Money – Gold Investing
- Gold performed exceptionally well during this period of economic turmoil. The price of gold rose from around $700 per ounce in late 2007 to over $1,000 per ounce by early 2009, and it continued to climb in the following years, reaching a peak of nearly $1,900 per ounce in 2011. Source: Reuters – Why Gold Is a Hedge for Nearly All Seasons